Developed as a consultant through the Data Science Student Society (DS3) at UC San Diego, this interactive global energy dashboard visualizes the strategic tradeoff between rising electric vehicle adoption and oil import dependencies across countries. Built for the UCSD Center for Energy Research to support policy research and energy transition analysis.
JavaScript
HTML/CSS
Data Visualization
Energy Analytics
DS3 Consulting
Global
Coverage
EV
Sales Trends
Oil
Import Dependencies
Role: Consultant — Energy Transitions · Data Science Student Society (DS3) @ UC San Diego · Jan 2026 – Present
A full-stack web application featuring global weather data and California grid load forecasting using machine learning. The dashboard predicts 14-day electricity demand across 4 California service areas using ensemble models trained on 315,648 observations.
React
Astro
FastAPI
Python
scikit-learn
Recharts
OpenWeather API
| Model |
MAE |
MAPE |
| Gradient Boosting |
573 MW |
2.26% |
| Random Forest |
577 MW |
2.29% |
| Ridge + Weather |
840 MW |
3.41% |
- SCE — Southern California (15M people)
- PG&E — Northern & Central CA (16M people)
- SDG&E — San Diego Area (3.7M people)
- VEA — Nevada/CA Border (45K people)
A machine-learning dashboard that predicts electric vehicle charging energy usage and cost across California. The system uses real-time Lasso regression powered by 3,500 charging sessions, 16,455 statewide stations, and county-level electricity rates.
Python
Streamlit
Lasso Regression
Figma
Data Visualization
3,500
Charging Sessions
16,455
CA Stations
58
County Rates
My contributions: Website design in Figma, model testing and validation
An award-winning AI healthcare tool that analyzes eighteen months of patient data to generate actionable insights for caregivers. It applies natural language processing with large language models via the OpenAI API and presents results in an interactive R Shiny dashboard with PDF export functionality.
R Shiny
OpenAI API
NLP
Healthcare Analytics
PDF Export
A comprehensive analysis of over 500,000 retail transactions to uncover behavioral patterns in customer activity. Using RFM (Recency, Frequency, Monetary) analysis, the study identified five distinct customer segments, revealed seasonal purchasing trends, and optimized marketing spend allocation by 25%.
SQL
Tableau
Python
RFM Analysis
Data Visualization
500K+
Transactions
5
Segments
25%
Spend Optimization
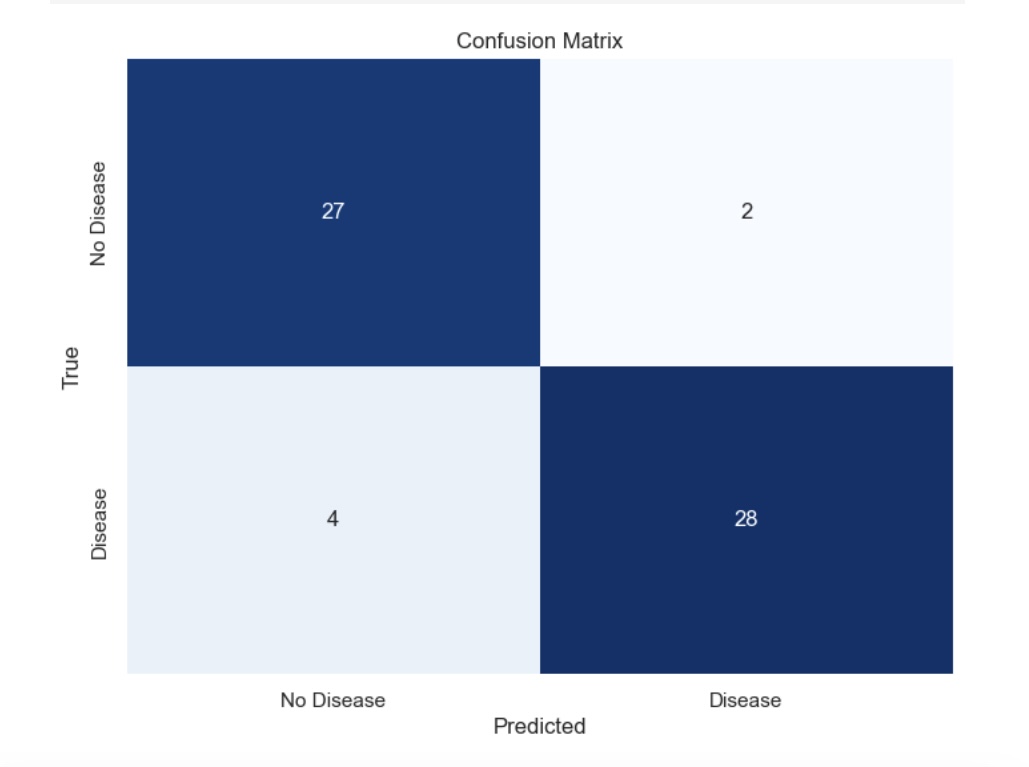
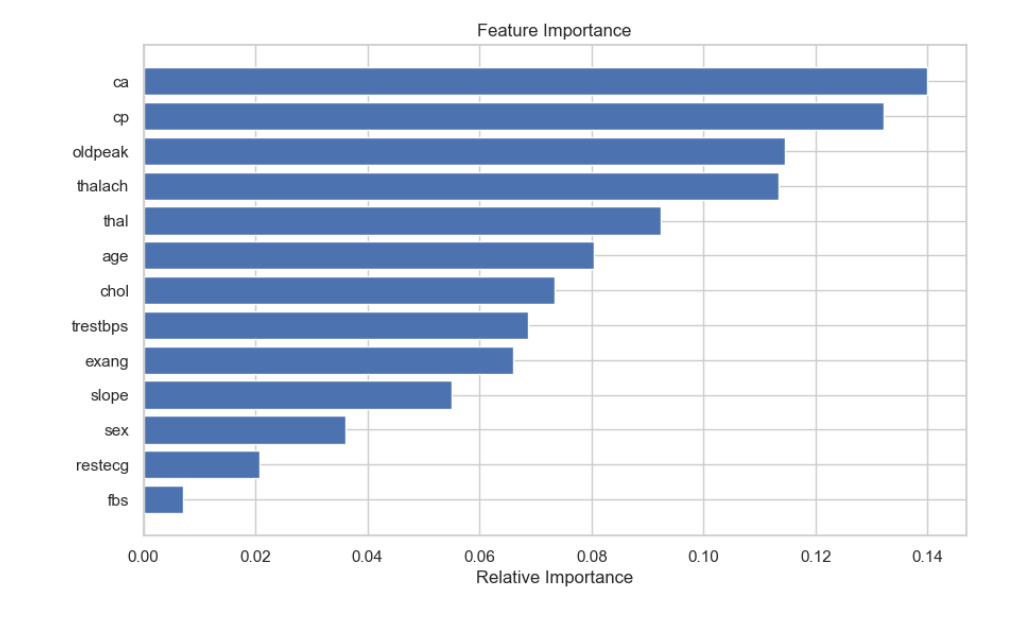
A machine learning pipeline that predicts cardiovascular risk using the UCI Heart Disease dataset. By addressing class imbalance with SMOTE and applying logistic regression, it achieved a 20% improvement in minority-class recall. The pipeline is designed for production deployment in healthcare analytics contexts.
Python
scikit-learn
SMOTE
Logistic Regression
Healthcare ML
+20%
Recall Improvement
SMOTE
Class Balancing
UCI
Dataset Source
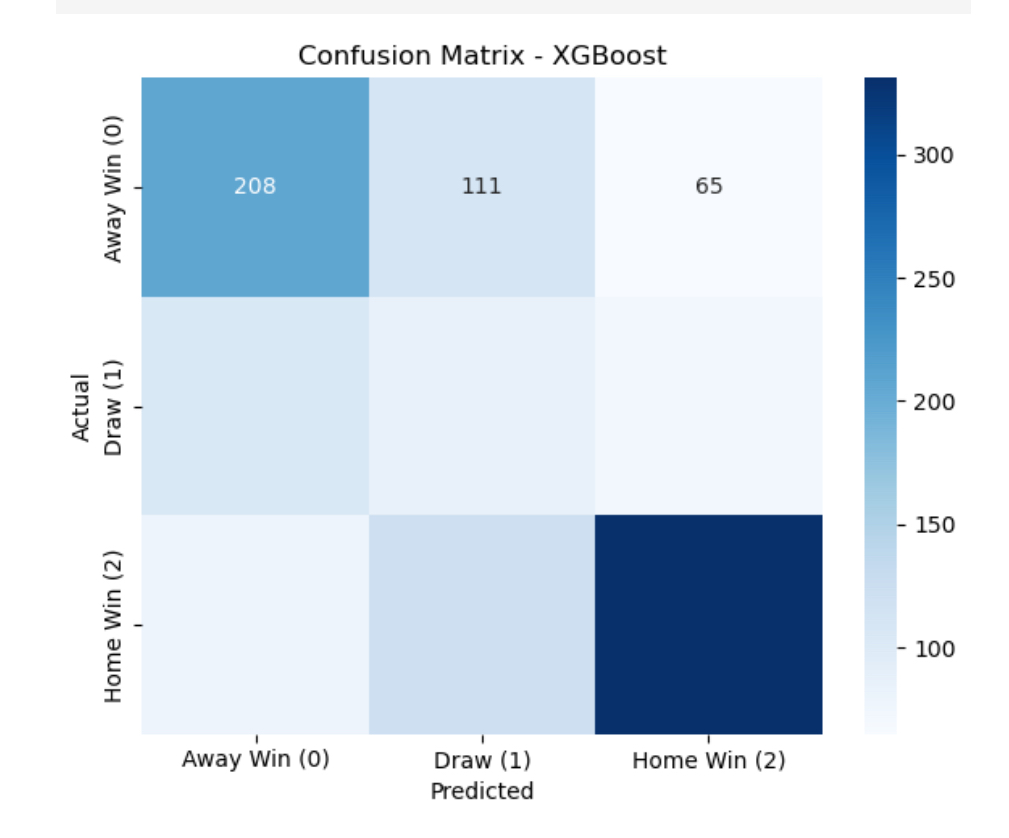
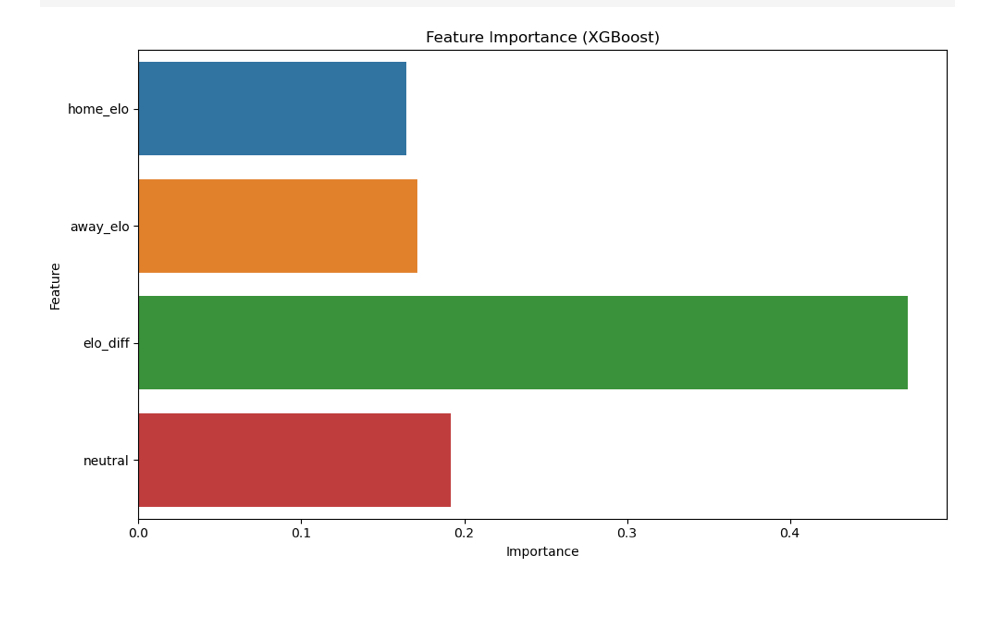
A sports analytics project developing predictive models for UEFA Euro 2024 match outcomes by combining ELO-based ratings with traditional statistical features. Models such as Decision Trees, Random Forests, and XGBoost were trained and evaluated using precision, recall, and F1-score to identify the most effective approach.
Python
XGBoost
Random Forest
ELO Ratings
Sports Analytics